
 Software Screenshots
The following screenshots represent the Kestrel TSCM ® Professional Software User Interface (UI) in a variety of different operational display states.

Our ability to refocus advanced display features using the same familiar workspace windows meets a standards-based, operator centric approach.
This structure simplifies operator interaction and allows advanced features to be presented as intuitive overlays.
User-Interface (UI)
Our operator centric user-interface renders the most essential controls and functionality up-front. Our simplified user workspace, is supported by drag and drop technology and intuitive, dynamically-linked control groups.

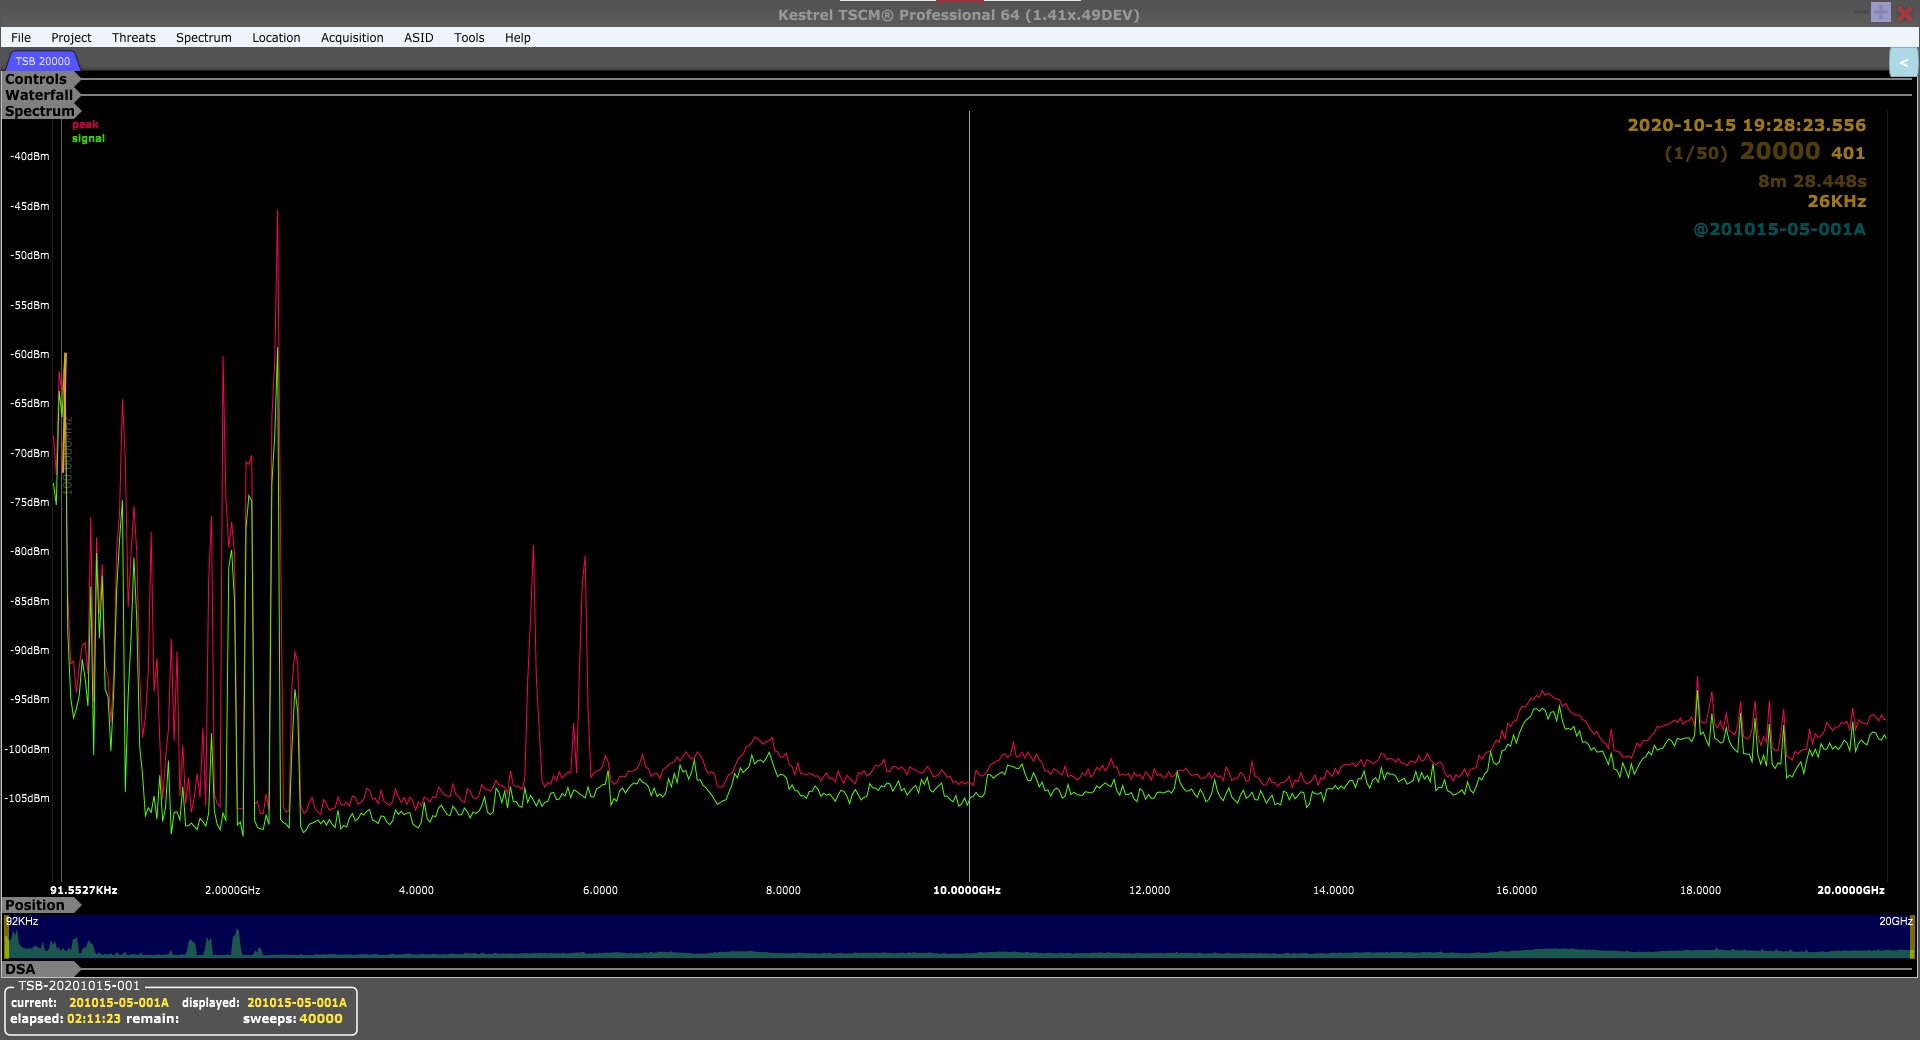
RF Spectrum Display (RSD)
The spectrum display enables multiple radio support from DC to 325 GHz, with existing Software Defined Radio (SDR) hardware support from 1 Hz to 54 GHz. The Kestrel TSCM ® Professional Software supports multiple spectrum bands, across multiple SDR radios, across multiple display monitors.

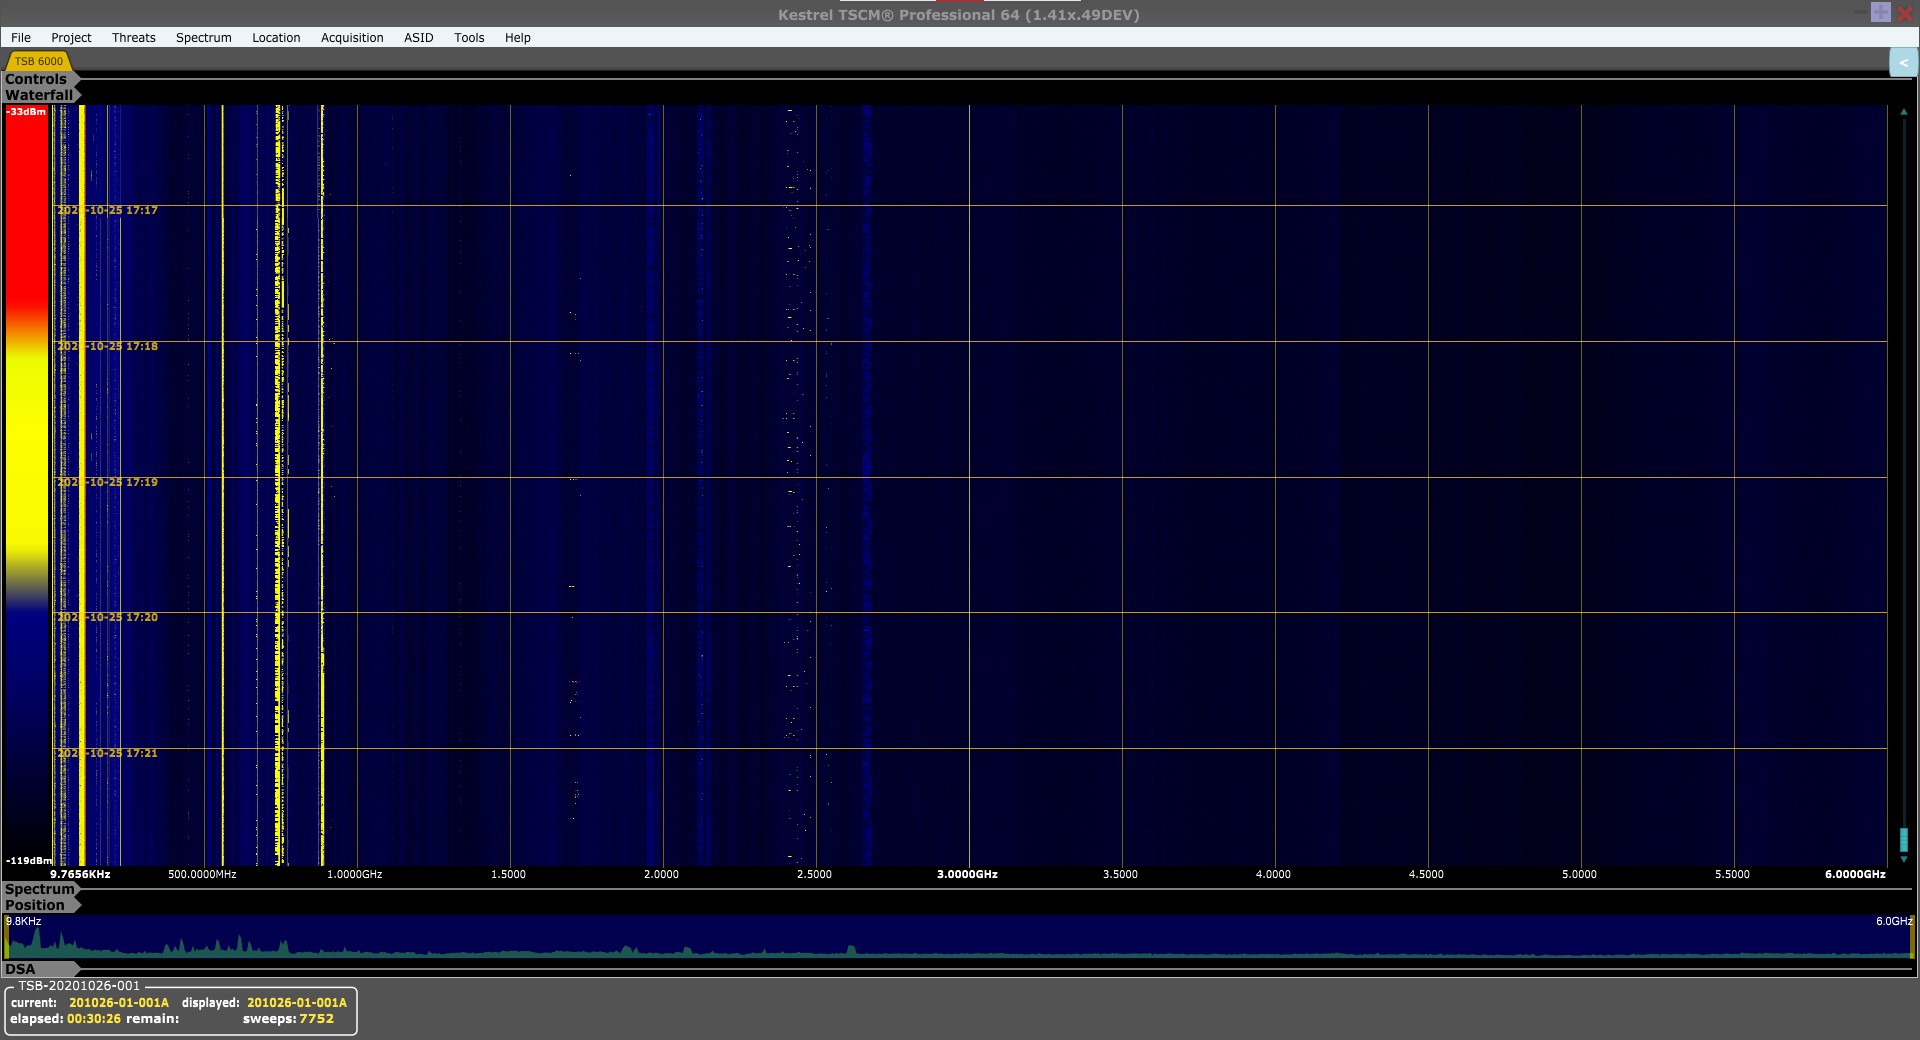
Waterfall Display (WFD)
The waterfall display is the most important visualization element utilized for the identification and analysis of time-periodic signals. The TSB 2000 (Technical) Standard TM defines this importance within a modern moving target threat model methodology.


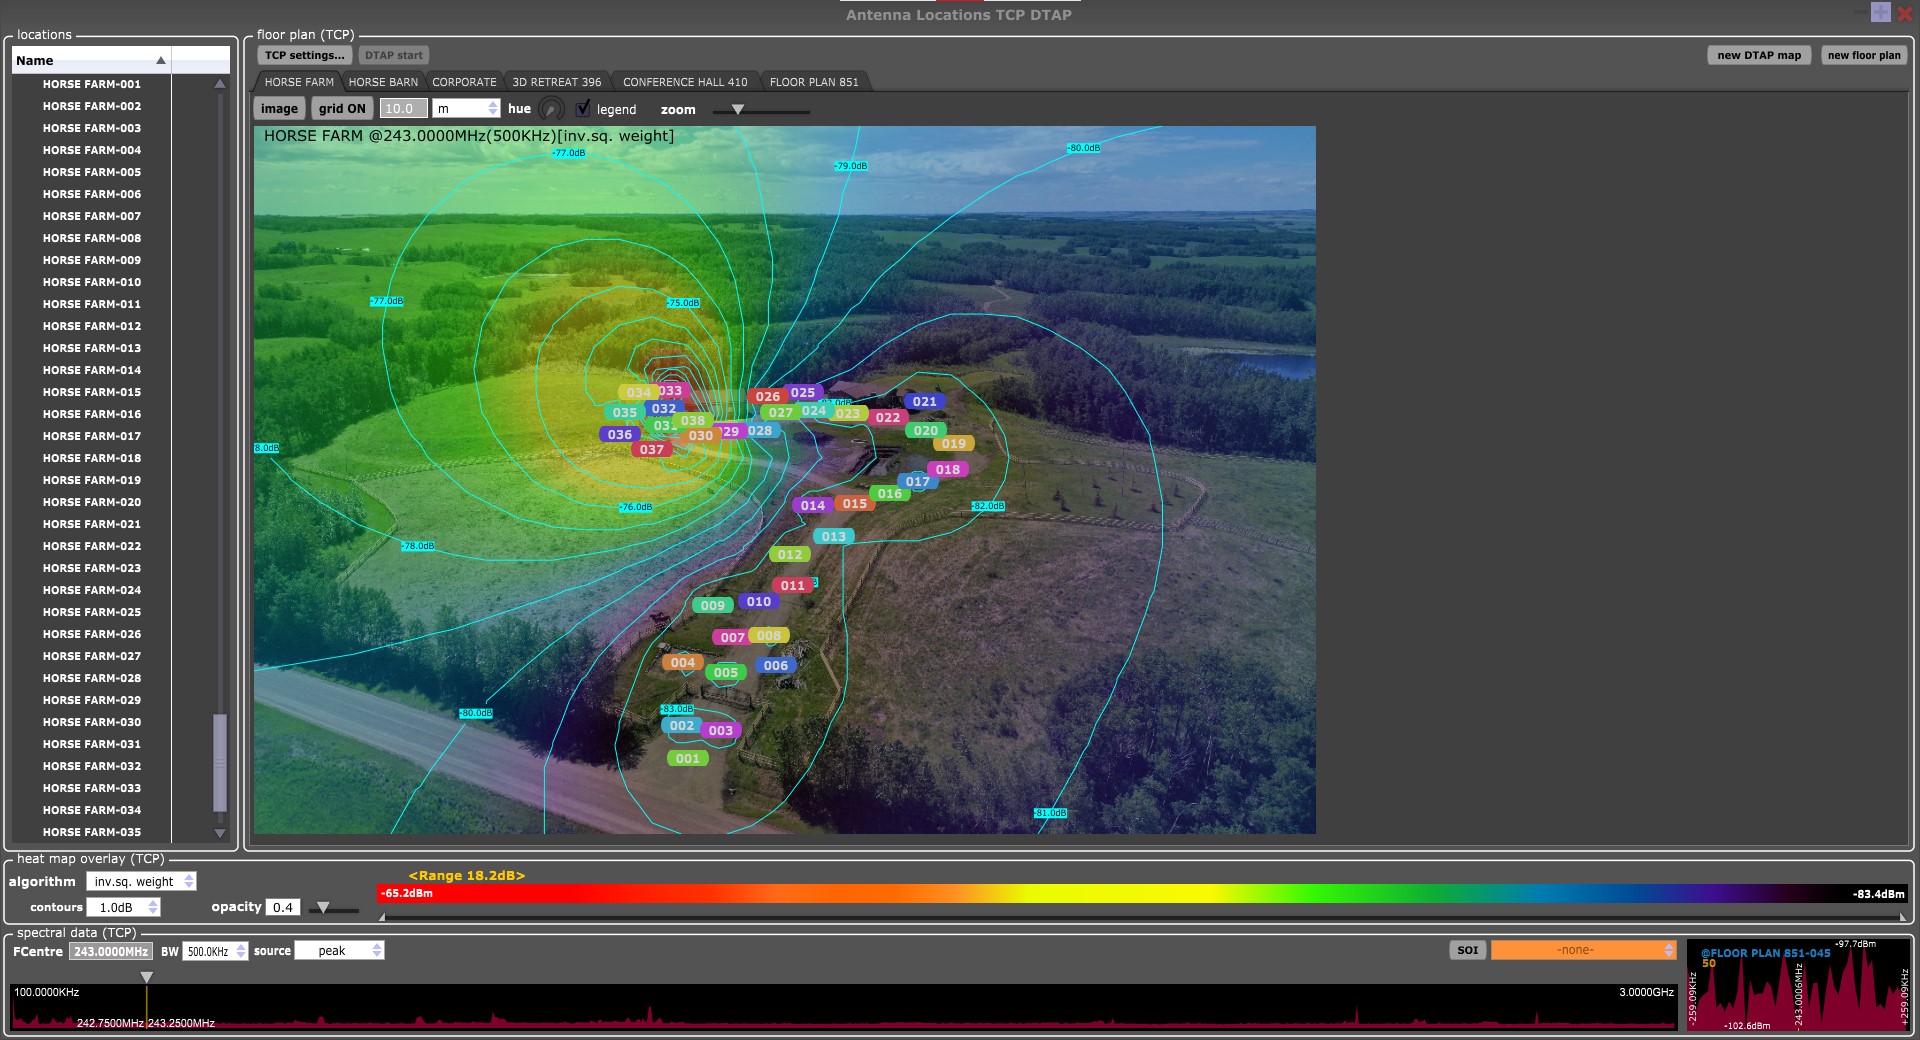
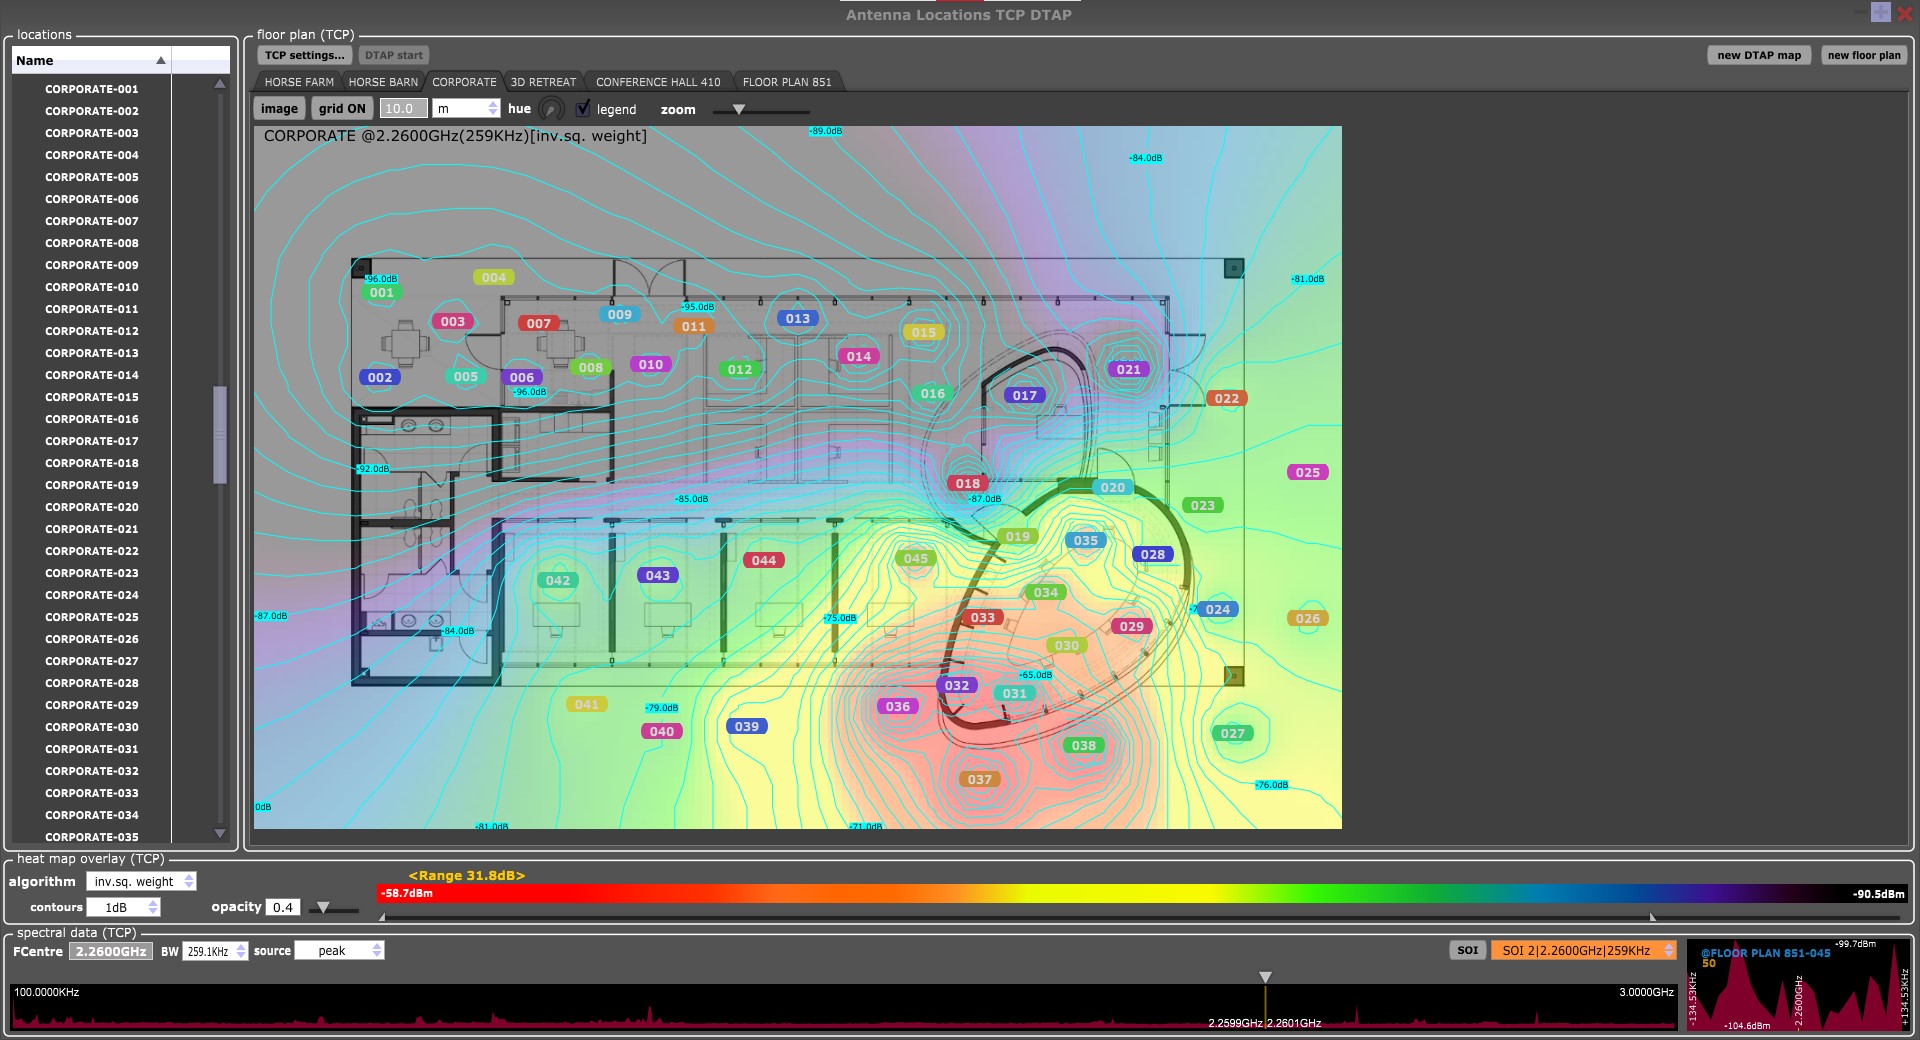
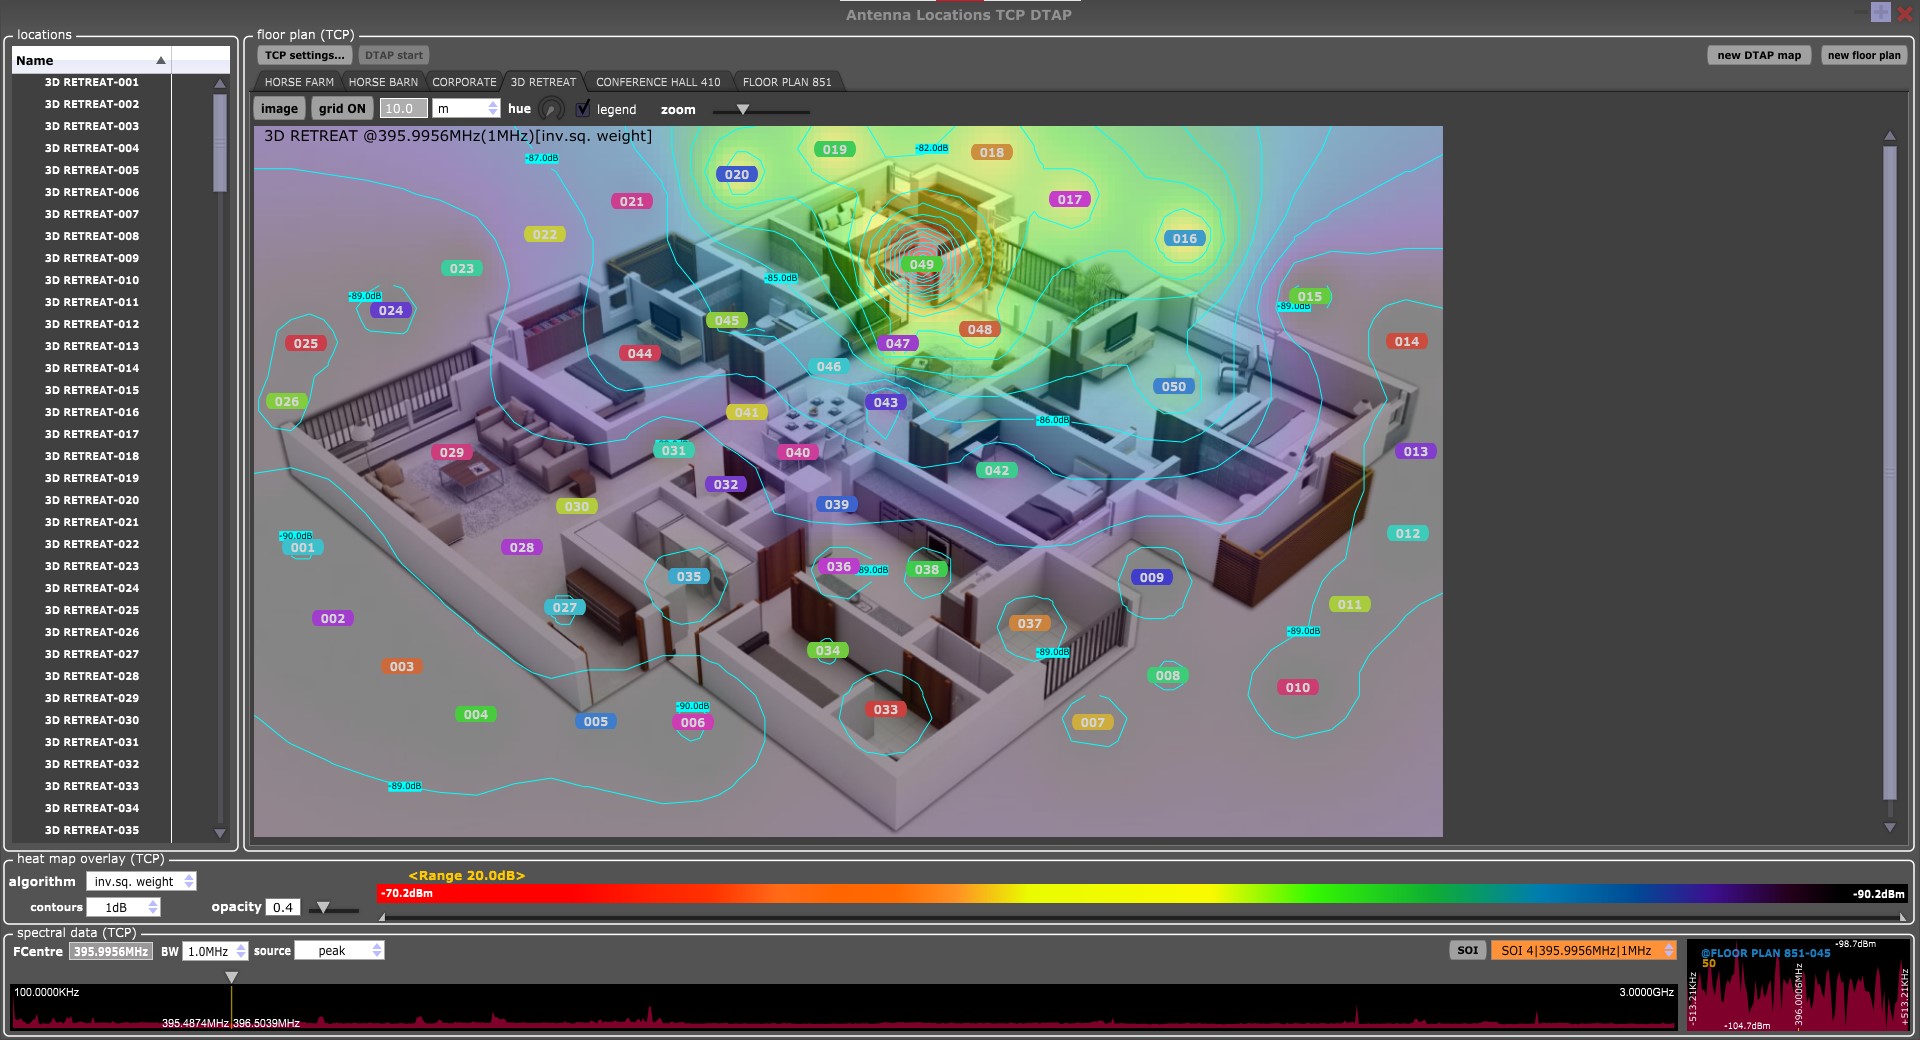
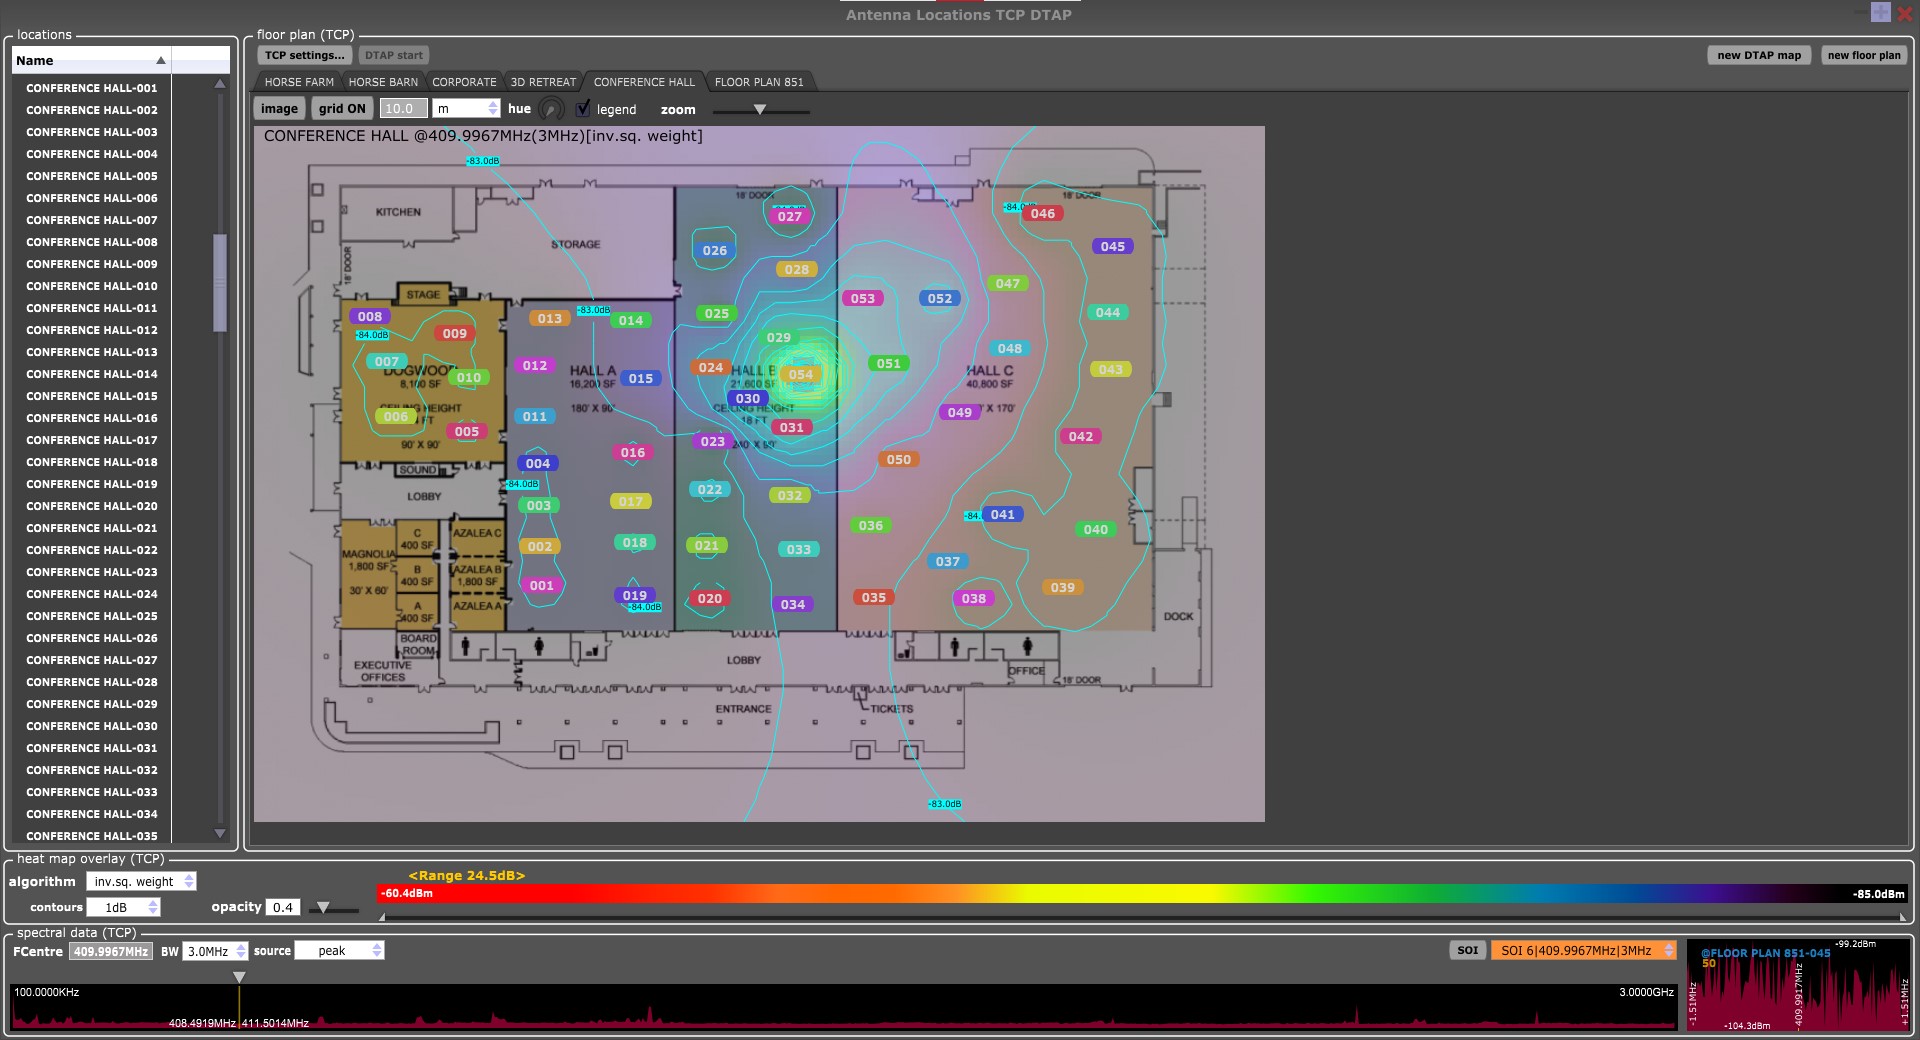
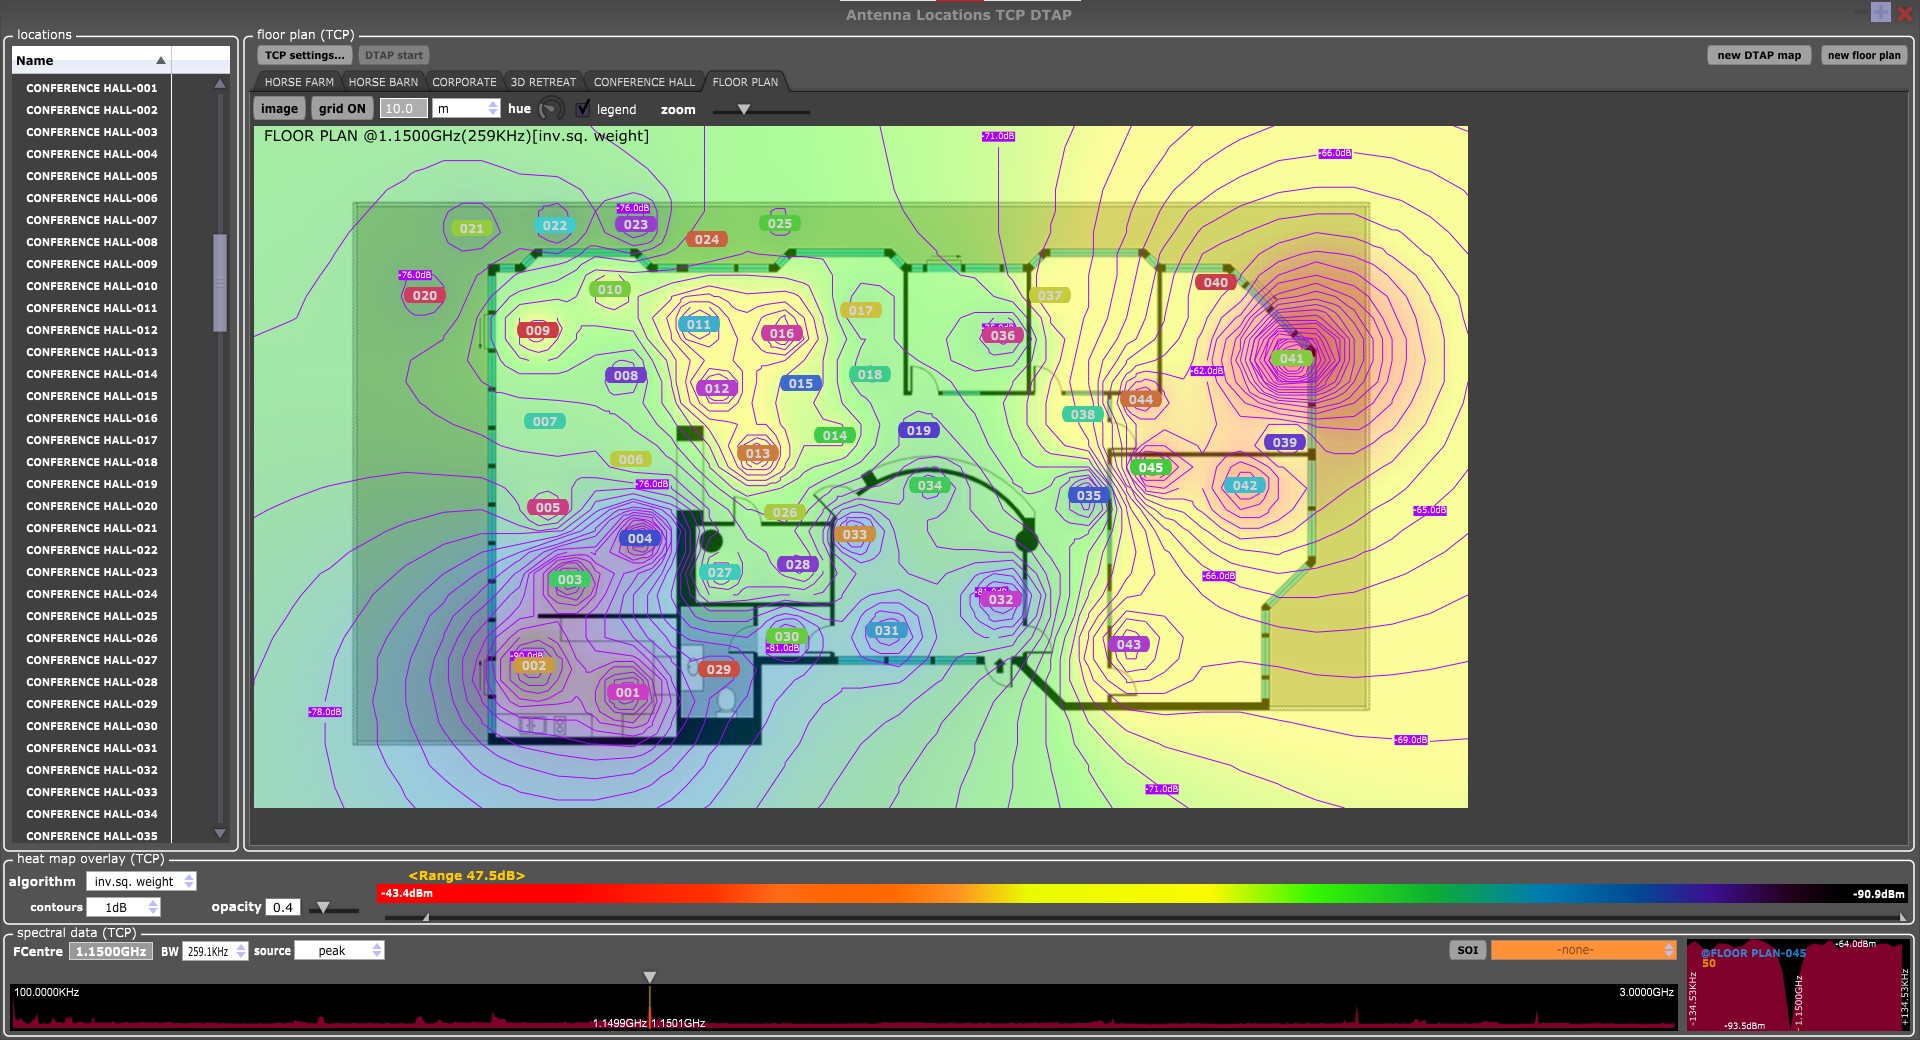
Geo-Location Heat Mapping
Geo-location heat mapping is a standards-based methodology that provides a total energy picture of all existing spectrum activity. It is essential to characterize the Operator Defined Target Area (ODTA) TM and determine the parameters of a larger Functional Target Area (FTA) TM.
Our industry unique TSCM focused geo-location heat mapping and RF Visualizer (RFV) TM are fully integrated with our Location Differential Signal Analysis (LDSA) TM and Receiver Differential Signal Analysis (RDSA) TM technology.
Enhanced geo-location heat mapping is included with our optional Tap Capture Plot (TCP) TM and Dynamic Trace Autonomous Platform (DTAP-GPS) TM software modules.


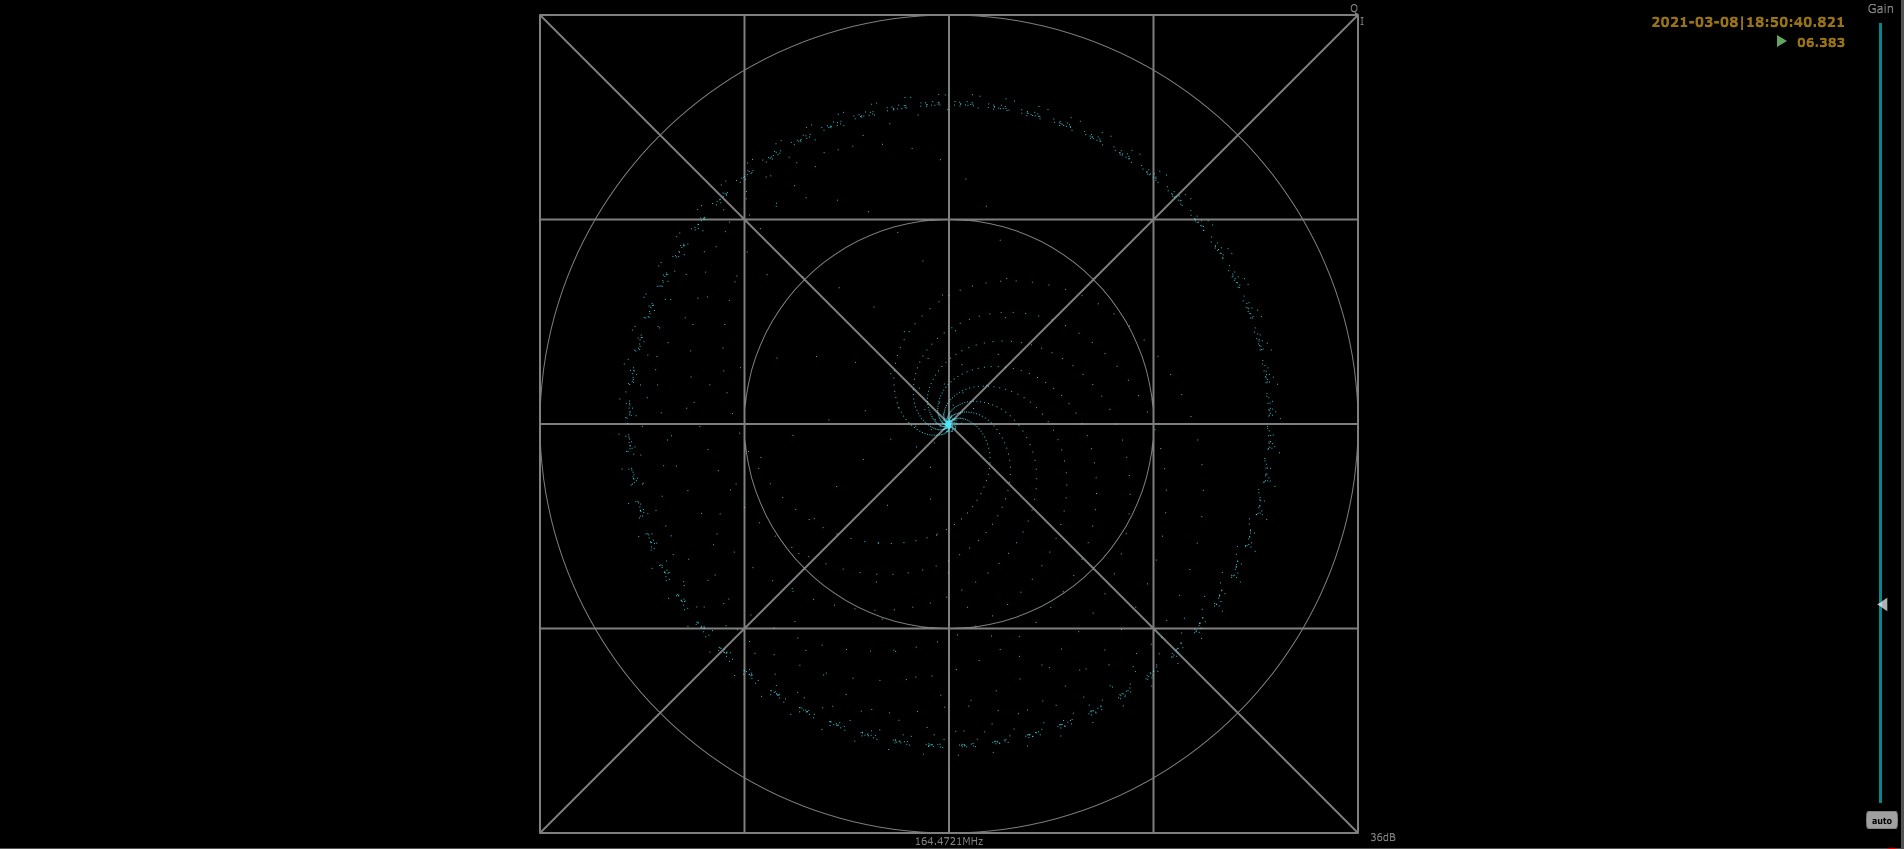
Demodulation Visualizer
Our demodulation visualizer feature includes a wide range of IF input and baseband output FFT display options that include an RF Spectrum, Audio Spectral Density, 3D Waterfall, IQ Diagram, IQ vs Time, RSSI History, Analog RSSI, Audio Oscilloscope, and AF Spectrum Display.


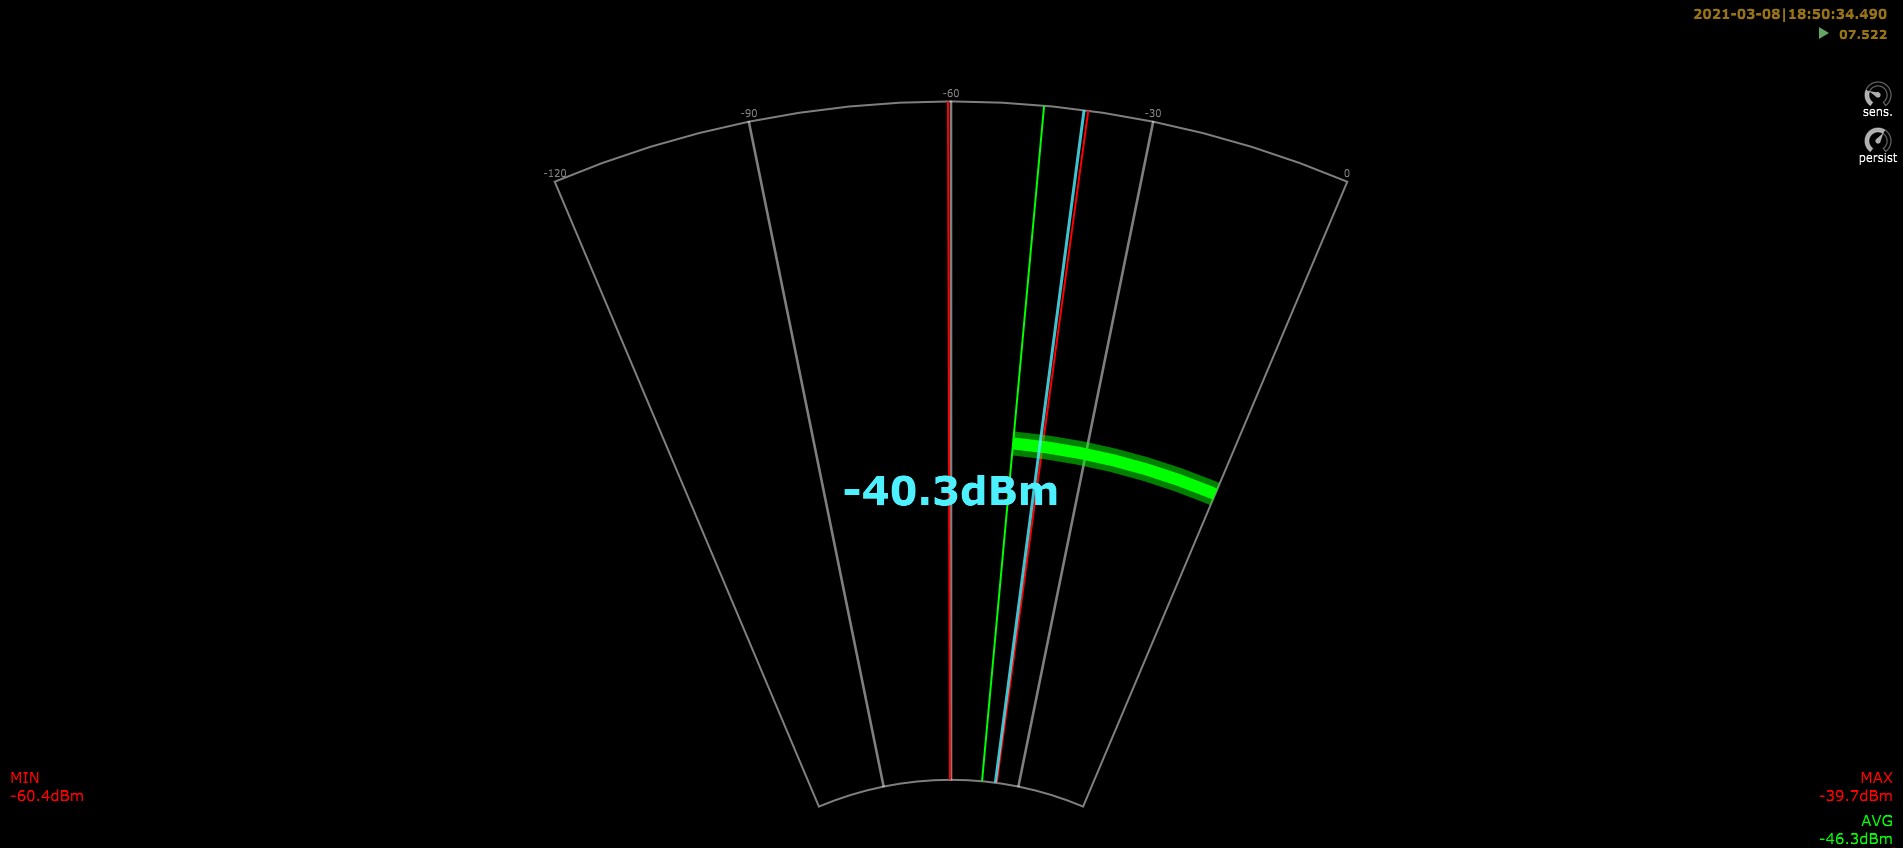


Kestrel ® Radio-Frequency Spectrum Artwork
The following examples represent the ambient RF spectrum environment artistically as captured by the Kestrel TSCM ® Professional Software. The unique clarity and profound operator centric capability of our Location Differential Signal Analysis (LDSA) TM features brings clarity and reason to a complex technical environment. every technical operator should have a framed series of Kestrel ® artwork hanging proudly on the office wall to remind them they are utilizing the leading TSCM | SIGINT software defined radio application. There is nothing like the Kestrel TSCM ® Professional Software.


