
 Signal Library
The following images are provided to illustrate various RF signal examples as captured by the Kestrel TSCM ® Professional Software, during runtime sessions.
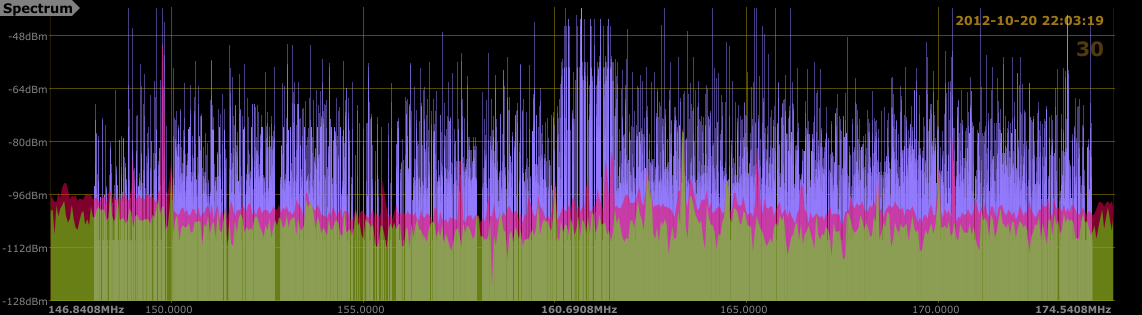
Direct Sequence Spread Spectrum (DSSS)

The above image illustrates a example of Direct Sequence Spread Spectrum (DSSS) as utilized by many cordless telephones, as well as audio based digital Technical Surveillance Devices (TSD).
ATSC Digital Television

The above signal illustrates a 6 MHz ATSC digital television signal event as displayed by the Real-Time Event (RTE) trace. The technical operator has activated the Kestrel TSCM ® Professional Software, Channel Profile Mask (CPM), to clearly identify the channel.
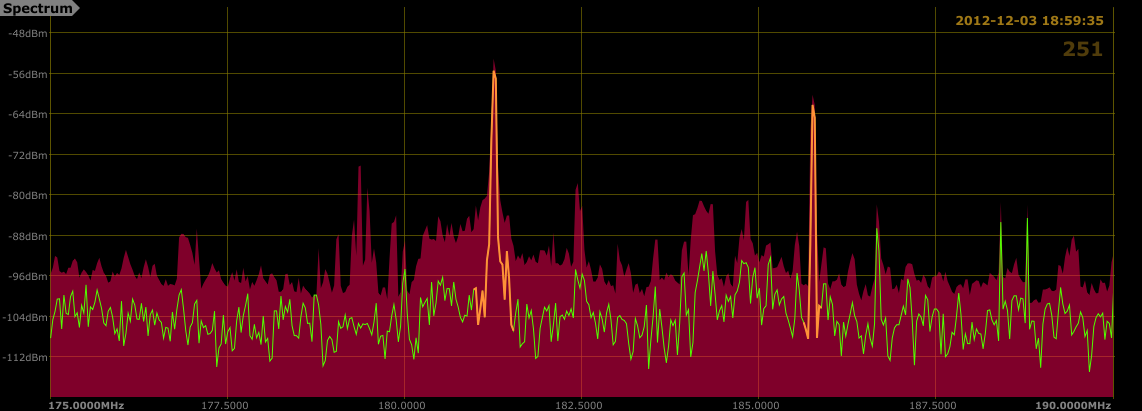
FM Broadcast | Standard | High Definition

The above signals illustrate two (2) separate commercial FM Broadcast channels operating within the FM band allocation 87.5 MHz to 108 MHz. The first signal is a standard FM station and the second station is an HD FM station.
NTSC Analog Television | Channel 8
The above VHF band signal event illustrates an NTSC analog television channel, with the AM video and FM audio carriers displayed.
900 MHz NTSC Baby Monitor (Video | Audio)

The above Real-Time Event (RTE) trace illustrates the video and audio signal characterization. The technical operator has marked the emitters as Signals of Interest (SOI).
Chirp Threat Mode (CTM)

The above Real-Time Event (RTE) trace illustrates the automatic detection and display of the fundamental frequency, for an analog audio transmitter (red), and the harmonic association of the 2nd and 3rd harmonic events (yellow).
Advanced Signal intelligence Database (ASID)
The above image illustrates the Industry Canada Spectrum Management Technical and Administrative Frequency List (TAFL), FDB overlay, displaying the expected Free Space Power (FSP) of known licensed transmitters relative to the geographical location of the target area.
Resolution Bandwidth (RBW) Series
Resolution Bandwidth (RBW) has a dramatic effect on the technical operators ability to display and resolve discrete signal events within the ambient RF spectrum environment.
The following links provide a series of visual examples of a spectrum analyzer display at different RBW settings to better assist the technical operator in understanding the optimal RBW settings that might be required, to capture and display potentially hostile signal events, and perform a detailed analysis.